Most people compare investments using returns only. But real financial planning is about returns + taxes + protection + access + certainty.
Let’s look at what actually happened when both strategies started with $100,000 in the year 2000.
Here’s a year-by-year breakdown showing what would have happened if you invested $100,000 at the start of 2000 in:
- S&P 500 total return (includes dividends reinvested)
- A hypothetical Indexed Universal Life (IUL) policy with:
- Cap = 11.75 %
- Floor = 0 %
- Point-to-point annual crediting
- No policy fees assumed (so this represents a best-case IUL crediting scenario)
The S&P 500 annual total return data (2000–2024) comes from StatMuse and YCharts (2025 value).
📋 Year-by-Year Returns & Account Balances
How to read this table:
- S&P 500 Return is the actual total return for that calendar year.
- IUL Return is the credited return (capped at 11.75% and floored at 0%).
- S&P 500 Value and IUL Value show the year-end account balance assuming you started with $100,000 on Jan 1, 2000.
| Year | S&P 500 Return | IUL Credited Return | S&P 500 Value | IUL Value |
|---|---|---|---|---|
| 2000 | −10.14% | 0.00% | $89,860 | $100,000 |
| 2001 | −13.04% | 0.00% | $78,122 | $100,000 |
| 2002 | −23.37% | 0.00% | $59,872 | $100,000 |
| 2003 | +26.38% | 11.75% | $75,655 | $111,750 |
| 2004 | +8.99% | +8.99% | $82,498 | $121,714 |
| 2005 | +3.00% | +3.00% | $84,973 | $125,365 |
| 2006 | +13.62% | 11.75% | $96,557 | $140,100 |
| 2007 | +3.55% | +3.55% | $99,962 | $145,248 |
| 2008 | −38.47% | 0.00% | $61,491 | $145,248 |
| 2009 | +23.49% | 11.75% | $75,873 | $162,380 |
| 2010 | +12.64% | 11.75% | $85,451 | $181,467 |
| 2011 | +0.00% | 0.00% | $85,451 | $181,467 |
| 2012 | +13.29% | 11.75% | $96,848 | $202,743 |
| 2013 | +29.60% | 11.75% | $125,567 | $226,565 |
| 2014 | +11.54% | +11.54% | $140,015 | $252,646 |
| 2015 | −0.73% | 0.00% | $139,014 | $252,646 |
| 2016 | +9.84% | +9.84% | $152,632 | $277,498 |
| 2017 | +18.74% | 11.75% | $181,247 | $310,153 |
| 2018 | −6.59% | 0.00% | $169,360 | $310,153 |
| 2019 | +30.43% | 11.75% | $220,841 | $346,643 |
| 2020 | +15.76% | 11.75% | $255,554 | $387,062 |
| 2021 | +26.60% | 11.75% | $323,467 | $432,522 |
| 2022 | −19.64% | 0.00% | $259,988 | $432,522 |
| 2023 | +23.79% | 11.75% | $321,963 | $483,137 |
| 2024 | +23.95% | 11.75% | $399,134 | $539,791 |
| 2025 | +17.88% | 11.75% | $470,572 | $603,138 |
📊 Key Results
Total Growth 2000 → 2025
- S&P 500 Value (with dividends reinvested): ~📈 $470,572
- IUL Cash Value (cap 11.75 / floor 0): ~📈 $603,138
📌 In this hypothetical scenario — without accounting for real IUL policy costs, fees, or mortality charges — the IUL cash value would be higher than the S&P 500 total return value.
⚠️ Important: Real IUL products do have policy fees and costs that reduce credited value (not included here). Actual IUL performance is typically lower than this best-case model.
🧠 What This Comparison Means
📈 S&P 500
- Includes full market upside and dividends.
- Experiences down years which reduce the account value in those periods.
🛡 IUL (Cap & Floor)
- Floor = 0% protects you from negative years — you never lose credited value in down markets.
- Cap = 11.75% limits how much you can gain in strong years.
- Over long periods, positive years below the cap still credit full return; years above the cap credit the cap.
- This model smooths growth and reduces volatility.
📌 Caveats & Real-World Considerations
✅ IUL Tax Advantages
- Cash value grows tax-deferred.
- Policy withdrawals/loans may be tax-free if structured correctly.
✅ Life Insurance & Living Benefits
- Most IUL policies include a death benefit (e.g. $1 M) and often access to accelerated living benefits.
❗ Real IUL Costs
- IUL policies have fees, mortality costs, and rider charges that reduce credited interest — this model did not include them, so results here represent a best-case IUL scenario.
📌 Market Reality
- Historical stock market returns are unpredictable; past performance doesn’t guarantee future results.
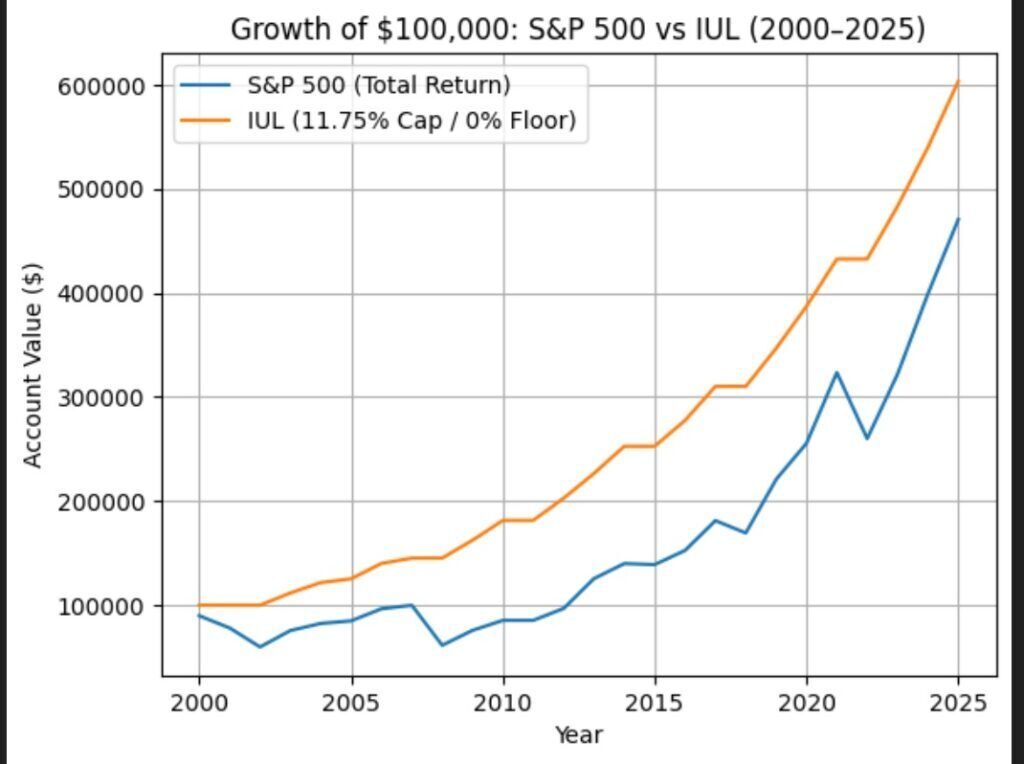
The Numbers (Same Start, Same Timeline)
- S&P 500 (Total Return, dividends reinvested)
- Ending value (2025): ~$470,000
- Multiple major crashes along the way
- Gains are taxable when withdrawn
- Indexed Universal Life (IUL)
- Cap: 11.75%
- Floor: 0%
- Ending value (2025, before policy costs): ~$603,000
- No negative years
- Tax-free access if structured correctly
Even before considering taxes and benefits, the IUL shows a higher ending value in this capped/floored scenario due to downside protection during major crashes.
Why IUL Wins Beyond Just the Chart
1. Tax-Free Withdrawals (IRC Rule 7702)
Under IRS Code Section 7702, life insurance policies:
- Grow tax-deferred
- Allow tax-free access via policy loans
- Provide a tax-free death benefit
📌 This means:
- No capital gains tax
- No required minimum distributions
- No income tax when structured and maintained properly
By contrast:
- S&P 500 money is fully taxable (capital gains, dividends, NIIT, state tax, etc.)
2. $1,000,000 Life Insurance from Day One
With an IUL, you don’t just invest — you transfer risk.
From day one:
- Your family gets $1,000,000 income-tax-free death benefit
- This is guaranteed regardless of market conditions
- Stocks do not provide protection if death occurs early
3. FREE Living Benefits (Built-In Protection)
Most modern IUL policies include living benefits riders at no extra cost.
What Are Living Benefits?
They allow you to access the death benefit while alive if you suffer a serious illness.
🔹 Chronic Illness
- Inability to perform 2 of 6 Activities of Daily Living (bathing, dressing, eating, toileting, transferring, continence)
- Or severe cognitive impairment
- Funds can be used for:
- Home care
- Assisted living
- Family caregiver support
🔹 Critical Illness
- Conditions like:
- Cancer
- Heart attack
- Stroke
- Major organ failure
- Lump-sum access to death benefit to pay medical or personal expenses
🔹 Terminal Illness
- Life expectancy of 12–24 months (varies by policy)
- Accelerated access to death benefit — tax-free
📌 The S&P 500 offers zero protection in these situations.
4. Sequence-of-Returns Risk Protection
From 2000–2002 and 2008:
- The market lost 40–50%+
- Investors who needed money during those years were permanently damaged
The IUL:
- Credited 0% instead of losses
- Locked in prior gains
- Continued compounding forward
This is especially critical for:
- Pre-retirees
- Retirement income planning
- Legacy planning
5. Additional IUL Advantages Most People Miss
✔ No market losses
✔ No contribution limits like 401(k)/IRA (when overfunded correctly)
✔ No age-based withdrawal penalties
✔ Creditor protection (varies by state)
✔ Not reported as income for FAFSA or many aid calculations
✔ Can be used as:
- Tax-free retirement income
- Emergency fund
- Opportunity fund
- Legacy vehicle
Final Verdict: Who Really Wins?
| Category | Winner |
|---|---|
| Volatility protection | IUL |
| Tax-free income | IUL |
| Death benefit | IUL |
| Living benefits | IUL |
| Behavioral safety | IUL |
| Pure upside in best years | S&P 500 |
| Real-world planning | IUL |
Bottom Line
The S&P 500 is a great growth engine.
The IUL is a complete financial tool.
When you factor in:
- Taxes
- Market crashes
- Health risks
- Income needs
- Family protection
👉 IUL doesn’t just compete — it wins in real life.